





AI coding agents are pretty awesome at helping me move projects forward. They can investigate an issue, make a change, and get a pull request ready while I am working on something else. But there is another part of that workflow that has to keep up: CI.
More agents means more branches, more pull requests, more updates to those pull requests, and more GitHub Actions jobs. Add Windows, Android, iOS, macOS, x64, and ARM64 into the mix, and one small change can turn into a whole lot of build machines doing work.
I could see it in my own usage throughout the year. The chart for my top repositories kept climbing, with a particularly noticeable jump toward the fall. That is the value of the Actions usage, not what I actually paid: much of it is included or covered by GitHub's free usage rules. Still, the growing compute footprint was a good reason to take a closer look.
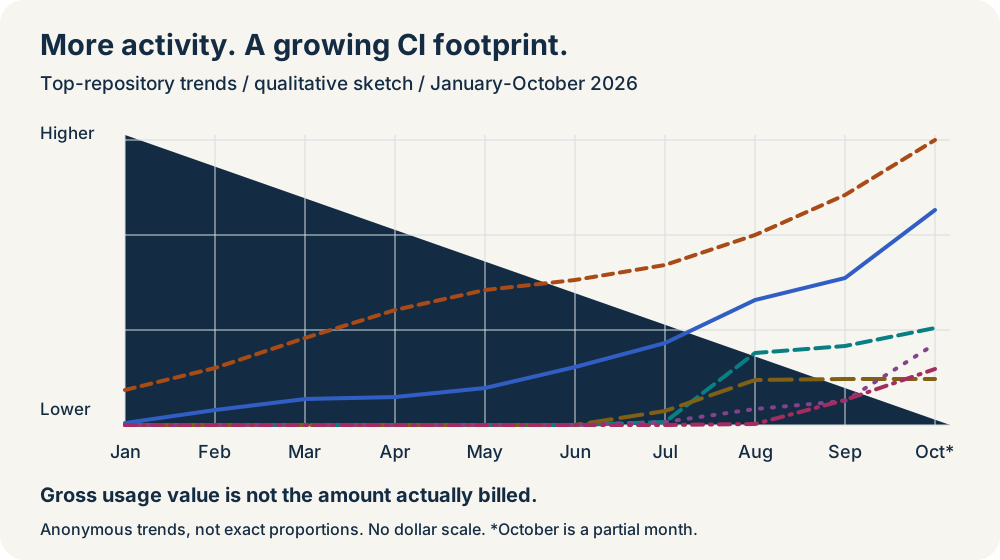
That was the problem I wanted to dig into across my apps. Not "how do I stop testing things?" Instead: how do I stop paying for, and waiting on, work that doesn't need to happen?
I used the GitHub Copilot app to analyze my GitHub usage export, inspect the workflows, and work through changes across repositories. Some wins were straightforward. One of the most useful discoveries was deleting caches we had just tried adding. That is right: a cache hit is not automatically a performance improvement!
The build matrix is a multiplier
Let's say an agent pushes three updates to a pull request, and each update starts four platform jobs. That is twelve jobs, before retries, release validation, or another agent working on another feature.
Parallel execution makes this easy to miss. Four five-minute jobs might finish in roughly five minutes if they start together, but they still consume about twenty runner-minutes. Queueing can make the wait longer without adding the same amount of execution time. A release waiting for approval is another thing entirely.
Those are different measurements:
| Measurement | What I want to learn |
|---|---|
| Runner execution time | How much compute did the jobs actually use? |
| Pull request feedback time | How long until I can act on a useful result? |
| Billed usage | What remains chargeable after GitHub's billing rules and allowances? |
The goal is to improve the right number, not just make a workflow page look shorter.
Start with the export, then follow it into the logs
My first prompt in the GitHub Copilot app was:
can you do an analysis of my actions across my repos running on windows and mac runners and see where we can optimize and cut costs
Then I attached the GitHub summarized usage CSV. My next message was simply:
Herei sm y usage report
Yes, typos and all. The useful part was supplying the data, not writing a magical prompt.
We looked at an October 1-24, 2026 snapshot containing 1,100 export records, reconciled it with GitHub's live billing API, and inspected 66 workflows across 14 repositories associated with Windows, macOS, or paid Actions usage. We also fetched 748 job records, not 748 independent workflow runs. That was complete for two paid hotspots, with selected representative runs elsewhere, not a complete performance census of every repository.
The export told us where to look. Workflow files and job logs told us what to change.
We separated setup, restore, compilation, tests, packaging, and cache transfer. We also checked whether a job really needed that operating system, whether superseded runs were still working, and whether "nothing changed" checks were allocating a native runner just to exit.
If your export includes gross usage, discounts, and net charges, keep those separate. An avoided dollar of nominal compute is not necessarily a dollar off your bill. I am deliberately not sharing my billing totals or repository-level billing breakdown here.
One more important limitation: a busy partial month is not a reliable annual forecast. It is an excellent place to find waste, though.
Put each job on the runner it actually needs
First things first: an Android build does not automatically need a Mac just because the same application also targets iOS.
For my FIRE calculator Android workflow, we moved from macos-15 to ubuntu-24.04, installed the Android-specific .NET MAUI workload, and configured the required JDK and Android SDK dependencies. We kept the required check name, tests, signing configuration, artifacts, and gates.
The hosted Android job completed in 2 minutes 35 seconds with all 447 tests passing. That confirms the Linux path worked; it is not a matched before-and-after speed benchmark. The signed AAB credential path was not exercised, and we did not dispatch a release to prove it.
Why move it? Here are the relevant GitHub standard runner list rates, checked October 24, 2026:
| Runner billing SKU | USD per minute | Relative to Linux x64 |
|---|---|---|
| Linux x64, 2-core | $0.006 | 1.00x |
| Windows x64, 2-core | $0.010 | 1.67x |
| macOS, M1 or Intel | $0.062 | 10.33x |
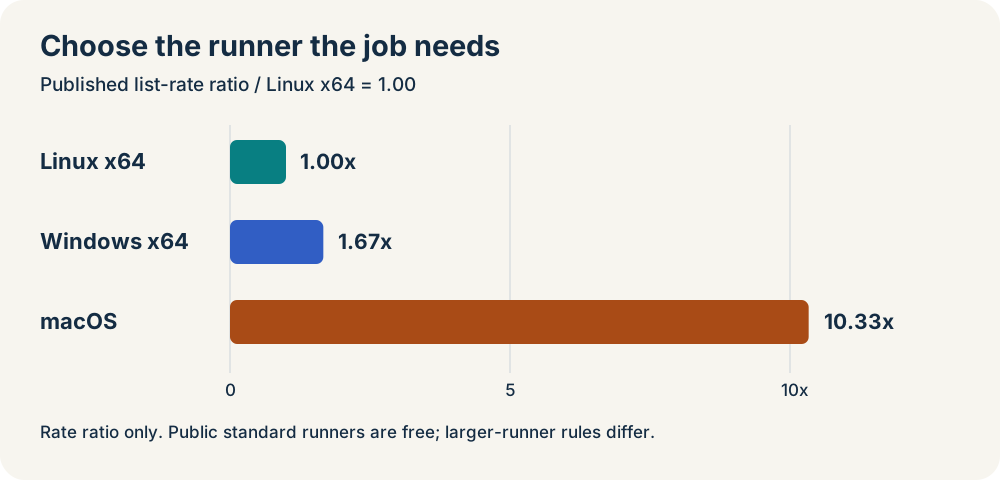
At equal billed runtime, moving eligible work from that macOS SKU to Linux x64 reduces its nominal compute price by about 90.3%. That is a rate comparison, not a measured reduction in my total bill.
In fact, this example is a public repository: standard GitHub-hosted runners are free for public repositories. For private repositories, included allowances and discounts affect marginal savings. Larger runners have different rules and are not free just because a repository is public. GitHub also rounds each job's partial minutes up to whole minutes.
The practical lesson is still useful: keep Apple builds on a compatible Mac, Windows-specific packaging on Windows, and move portable work only after proving it works elsewhere.
Don't start an expensive machine to say "nothing changed"
Another discovery was in My Stream Timer. Its required Core test and x64/ARM64 matrix checks still needed to report results, including when a change did not affect the app.
Simply skipping an entire workflow is not a safe substitute for understanding your branch rules. Required checks can end up waiting for a result that never arrives.
Instead, we kept the check names and matrix shape. No-change checks run on Ubuntu; actual Windows work still runs on Windows.
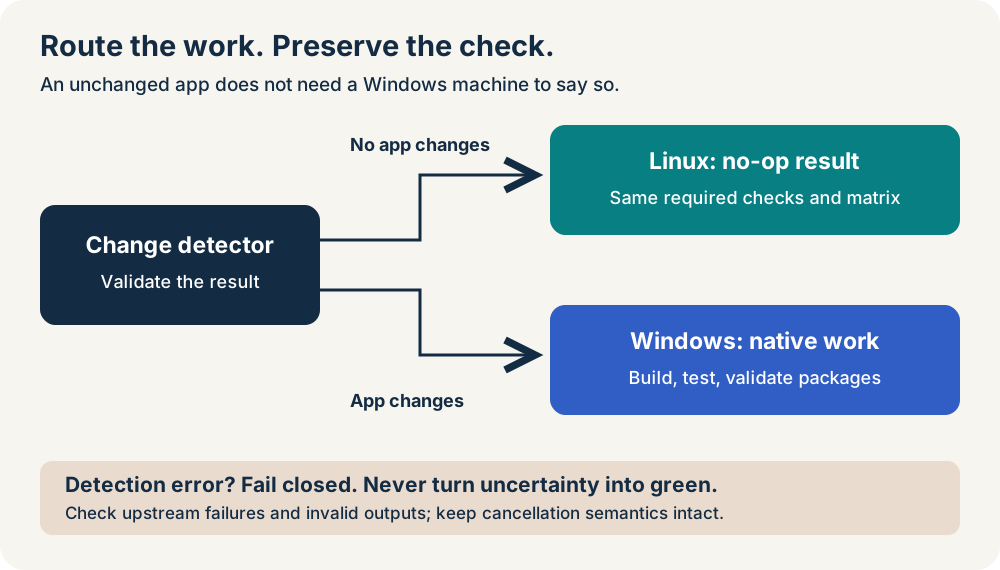
There is a gotcha here: a failed change detector must not become a successful no-op. We checked invalid outputs, upstream failures, and cancellation as well as the happy path. Hosted Windows packages for both architectures, tests, and package validation passed. Seven live routing fixtures exercised the no-change and failure/cancellation paths.
This proves the routing behavior. We did not collect a controlled per-run latency benchmark, so I am not attaching a made-up number to it.
Cancel superseded CI, not releases
When an agent pushes a fix while the previous build is still running, do you need both ordinary CI runs to finish?
Usually, I want feedback for the newest commit. Workflow- and pull-request-scoped concurrency lets us stop spending time on an obsolete revision without having different workflows cancel each other.
Here is a small illustrative example for ordinary pull request CI, not a drop-in release policy:
on:
  pull_request:

concurrency:
  group: ${{ github.workflow }}-${{ github.event.pull_request.number }}
  cancel-in-progress: true
We added scoped cancellation to ordinary build workflows in Tiny Clips and OutroKit. Release publishing and deployment workflows were not the target.
Cancellation cannot refund work that already ran. Its payoff depends on how often updates overlap and how much execution remains when the new commit arrives. Measure that instead of assuming every canceled run saves its full duration.
Measure the cache, including moving the cache
This was my favorite part of the investigation.
In Tiny Clips, we tried separate NuGet download caches for direct x64 builds, direct ARM64 builds, Store builds, and tests. That sounds pretty reasonable. However, downloading and unpacking a cache takes time too.
For the direct builds, warm cache-plus-restore paths were 16 seconds slower for x64 and 10 seconds slower for ARM64 than direct restore without the cache. Even the Store cache, which improved over its cold-fill path, was about seven seconds slower warm than restore alone.
We removed all three build caches.
The test cache was different:
| Test dependency setup path | Observed time |
|---|---|
| Restore without the cache | 32 seconds |
| Cold cache path, including its save | 44 seconds |
| Warm cache path, including cache overhead | 21 seconds |
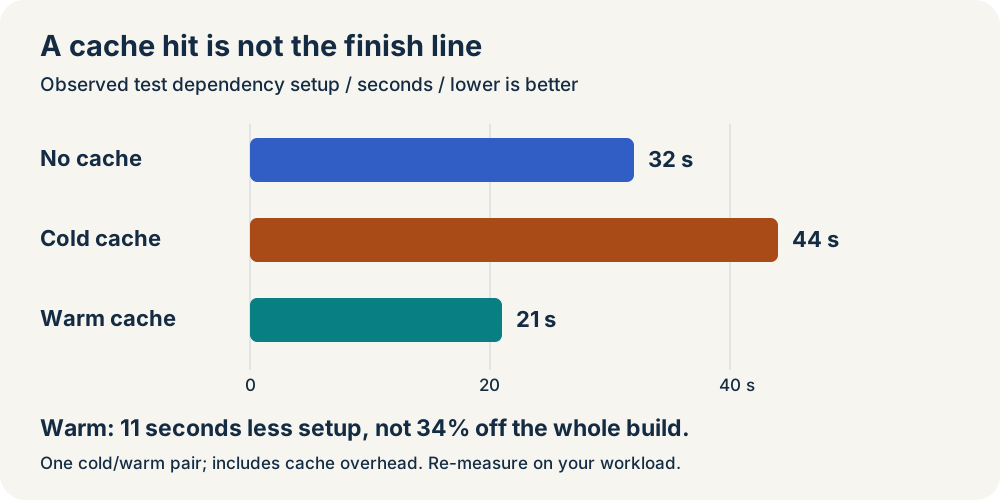
That is an 11-second warm setup improvement, about 34% of this setup phase. Not a 34% faster application build! The retained test cache was about 0.45 GiB, compared with roughly 3.80 GiB across the initial cache experiment.
The decision rule is pretty simple:
Compare cache lookup, download, extraction, remaining restore, and post-job save against the no-cache restore. A green "cache hit" message is not the finish line.
We kept full platform coverage. Tiny Clips validation included Windows packages for both architectures and the Store flavor, 2,388 Core test cases with zero failures and four skips, 218 passing App tests, plus 398 Mac tests and a Mac App Store build.
In OutroKit, we retained fresh restores in each job and scoped NuGet download caches by OS, architecture, and dependencies. The full Linux, Windows, Intel Mac, and Apple Silicon Mac test matrix remained. All six jobs passed, and the pack job reused the exact build cache. That establishes correctness and reuse, not a controlled speedup measurement.
Fix the environment, not just the cache
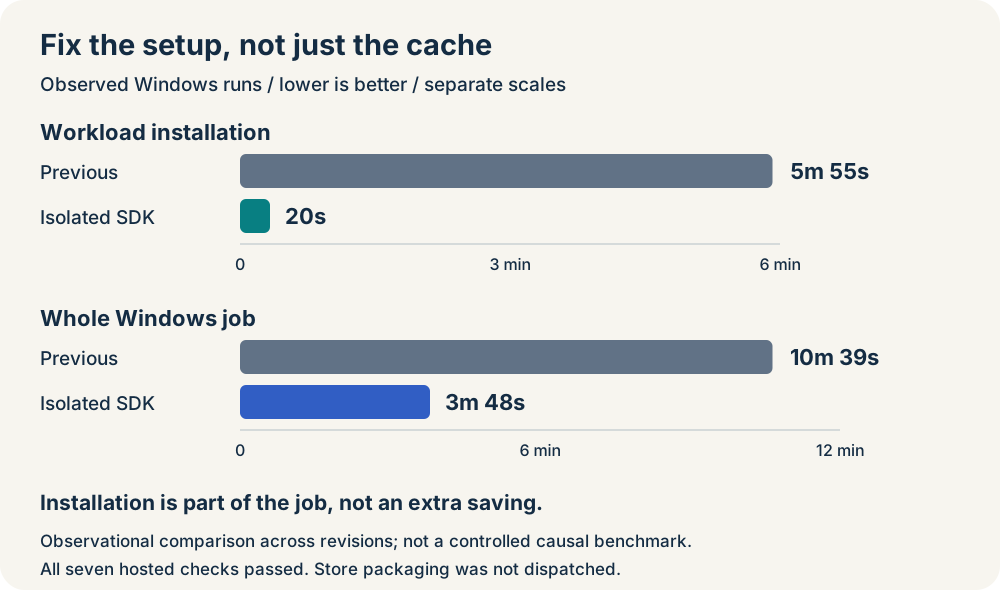
Across other cross-platform apps, Windows MAUI workload installation was an obvious hotspot: roughly six and a half to seven minutes in representative jobs.
Tempting solution? Cache the workload folders and skip installation.
Not so fast. The logs showed MSI-managed components and machine-wide Windows Installer state. Restoring a directory is not equivalent to installing that toolchain correctly. We deferred workload-folder caching rather than trade a slow reliable build for a fast mysterious one.
But that did not mean giving up on setup. In my file converter, the preinstalled SDK was reconciling unrelated Visual Studio Android, Apple, and WebAssembly workloads when we only wanted maui-windows. Instead of caching that machine-wide state, we used actions/setup-dotnet with DOTNET_INSTALL_DIR pointing to a fresh directory under runner.temp. The isolated SDK uses file-based workload installation; we still install and verify the pinned workload explicitly. No registry edits, deleting installer markers, or pretending a folder restore is an installation.
The observed Windows workload-install step went from 5 minutes 55 seconds to 20 seconds, and the whole job from 10 minutes 39 seconds to 3 minutes 48 seconds. All seven hosted checks passed, including the Windows app build and native shell checks. These are observations across workflow revisions, not a controlled benchmark attributing every second to SDK isolation; Store packaging was not dispatched.
Some optimizations should stay on the drawing board
Apple pipelines had a similar lesson: a small test body can sit inside a much longer compile, install, simulator startup, and test operation. Profile the whole operation before deciding that deleting tests is the answer.
In one iOS cache experiment, the warm run avoided recompiling unchanged Swift files and cut a portable test step from about two minutes to 17 seconds. Awesome, right? Except the whole workflow went from 11 minutes 15 seconds cold to 14 minutes 53 seconds warm. Setup and native-test overhead outweighed the compilation win. One pair is not a controlled benchmark, but it certainly does not justify claiming overall savings.
We rejected that iOS cache experiment rather than keep the overhead and complexity. The final proposal keeps earlier simulator startup and disables Homebrew's automatic update/cleanup, with all 52 tests preserved. Its uncached run took 11 minutes 27 seconds, near the audit median, so I am counting zero overall savings from it. Source-built media caching in my file converter also has no verified hosted warm-hit benefit yet.
For the converter, I also explicitly chose faster automatic PR checks with full Mac proof on demand. The initial full Mac job took 9 minutes 17 seconds; compile-only checks took 3 minutes 10 seconds in one run and 4 minutes 15 seconds in the latest. Those are observational timings on differing runner images, and this is an intentional change in coverage frequency, not a cache speedup or identical work running faster. Automatic Mac compilation/static guards remain; the manual media, sandbox, and runtime proof must run for the exact release candidate before Store approval. Store signing and approval boundaries stay separate.
The media cache also correctly missed when the runner image changed. That is a safety check doing its job, not evidence of a warm-cache speedup. A reusable media cache must contain verified unsigned source-built outputs, never signing credentials or signed app bundles.
The prompts were a starting point, not the quality gate
After the analysis, my next actual prompt was:
Let's send PRs for all of these please with optimizatons
In the GitHub Copilot app, that became separate, isolated coding sessions for the repositories. Each could inspect its own workflow, make changes, and bring back a pull request and hosted CI evidence. The useful part was being able to coordinate the results: keep the good cache, remove the slower ones, preserve the required checks, and challenge optimizations that were not safe.
For a repeatable version of this process, here are suggested follow-up prompts, not quotations from my original conversation:
Analyze this GitHub Actions usage export alongside the workflows
and representative job logs. Separate runner execution time,
feedback latency, gross usage, discounts, and net billed charges.
Identify the highest-impact changes and the evidence for each.
Do not publish the raw export or private billing details.
For each proposed optimization, preserve required check names,
platform coverage, signing boundaries, and release gates unless
I explicitly approve a behavior change. Explain what can run on
Linux, what must stay native, and how failures propagate.
Measure no-cache, cold-cache, and warm-cache setup, including
lookup, transfer, extraction, restore, and post-job save time.
Remove caches that do not beat the no-cache path. Report sample
size and limitations; do not claim overall workflow speedups
from setup-only measurements.
Validate with hosted CI and report exactly what passed, what was
not exercised, and whether the PR is open or merged. Do not
dispatch a signed release just to test an optimization.
I like this approach because the agent is doing the investigation and implementation, but the acceptance criteria are still concrete. "It should be faster" is not enough.
So, how much time and money does this save?
Putting the changes together, a reasonable planning scenario is roughly 45-51% less nominal compute cost and 10-20% fewer runner-minutes for the example workload below. That combines cheaper runners, less redundant execution, and the test cache that actually helped. It is an estimate informed by our tests, not a measured reduction across my account.
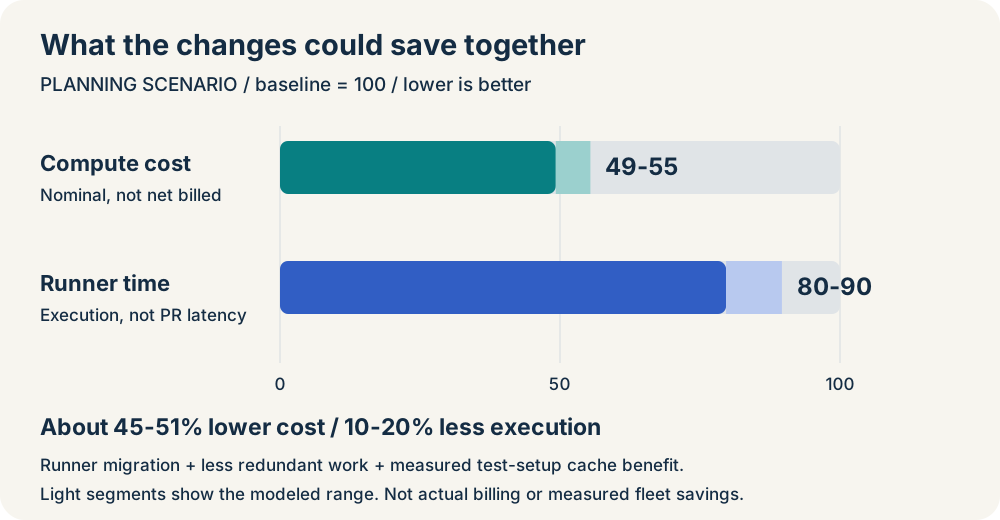
The assumptions: 100 five-minute jobs split 40 Linux, 20 Windows, and 40 Mac; move 20 eligible Mac jobs to Linux at equal runtime, then avoid 10-20% of execution proportionally through cancellation/no-change routing, net of routing overhead. Twenty of the original Linux jobs also get the observed test-setup cache benefit, assuming 80% warm hits and including cold-cache penalties, scaled down with the avoided work. That works out to about 52-102 runner-minutes saved per 100 jobs. The job mix and avoidance rate are illustrative assumptions, not measurements of my fleet.
Actual billed savings depend on free usage, allowances, and per-job rounding, which this approximate model does not calculate. Less total execution also does not mean every PR finishes 10-20% sooner. Still, it gives us a useful target to compare with the next usage report, without counting unproven optimizations as wins!
Make the next build smarter
The big takeaway for me is not to use fewer agents or stop building cross-platform apps. It is to make the CI graph as intentional as the code those agents are changing.
Start with your usage export. Follow the expensive work into job logs. Put portable work on the right runner, stop obsolete builds, keep required checks truthful, and make caches earn their place.
Then let the agents help with the cleanup, and ask them to bring back the evidence. More pull requests do not have to mean proportionally more wasted CI.